Uncertainty of radiocarbon date quoted by 14C laboratory usually comprises uncertainties connected with 14C counting statistics, and with fluctuating level of contamination introduced during sample preparation, and fluctuating parameters of 14C- measurement.
Typical precision of our 14C dates
Uncertainty (error, precision) of 14C date (1-sigma) quoted by the Poznań Radiocarbon Laboratory is determinted basing on counting statistics or standard deviation of results (5 at least) of partial 14C measurements of the dated sample, and of the samples of modern standard and background. Practically, significant deviations between these two estimates occur very rarely.
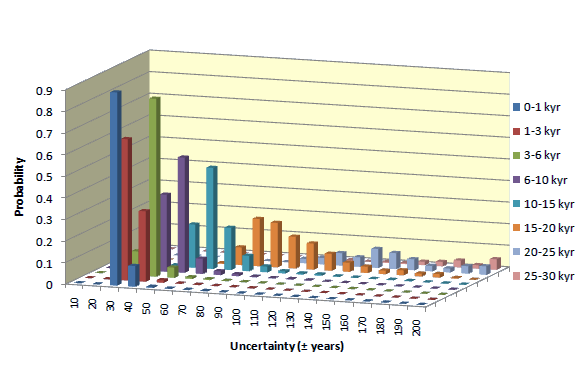
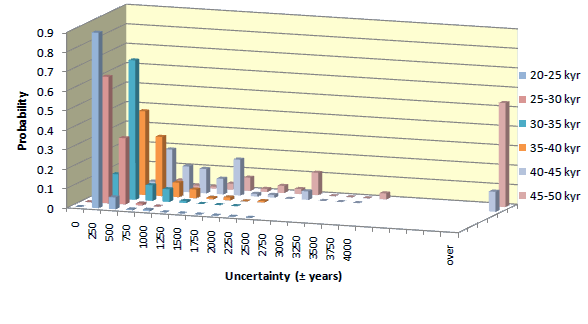
Average precision of 14C date depends on the age of sample. For young samples, the precision is mainly limited by 14C counting statistics, and when very many 14Cs are counted – by reproducibility of sample preparation. For very old samples, the crucial component of date uncertainty is fluctuation of background level, depending on the AMS spectrometer itself, and on contamination introduced during sample preparation.
Uncertainty of individual 14C date may differ from the average. The statistics of uncertainties of 14C dates obtained for samples containing >1 miligram of carbon, is presented in diagrams shown below. Uncertainties of dates of samples smaller than 1 mgC increase with decreasing mass of sample.


Small samples
Routinely, for 14C AMS measurement we forward 1 miligram of carbon. To analyse smaller samples, we studied the dependence of background on sample mass (using many small background samples), and studied efectiveness of correction for isotopic fractionation. These studies showed increasing scatter of 14C/12C ratios with decreasing mass of background samples. They also showed decrease of 13C/12C ratio with decreasing sample mass and demonstrated, that fractionation correction normally used in 14C measurements was not always effective for samples smaller than ca. 0.2 mg C.
The error of dates increases with decreasing mass. For young samples, it is mostly due to uncertainty of isotopic fractionation correction. For old samples, uncertainty of background and low number of 14C counts becomes most critical. Average errors of our 14C dates, for different sample ages and sample masses, is shown in table displayed below.
For very small samples, we from time to time fail to make 14C measurement. Frequency of so unlucky measurements (denoted in the table as “failed”) increases with decreasing mass of carbon (in the rage 0.1-0.2 mgC we fail to date ca. 10% of samples).
|
Average uncertainties of 14C dates reported by the Poznań Radiocarbon Laboratory, shown for different sample ages and different masses of carbon
|
|||||||||||||
| Age (kyr BP) | failed | 0-1 | 1-3 | 3-6 | 6-10 | 10-15 | 15-20 | 20-25 | 25-30 | 30-35 | 35-40 | 40-45 | 45-50 |
| Mass (mg C) | % |
± average error (yrs )
|
|||||||||||
| >1.0 |
—
|
30 | 35 | 40 | 50 | 60 | 100 | 270 | 340 | 520 | 660 | 1200 | 2000 |
| 0.8-1.0 |
—
|
30 | 35 | 40 | 50 | 60 | 110 | 270 | 360 | 550 | 700 | 1300 | 3000 |
| 0.6-0.8 |
—
|
35 | 35 | 40 | 60 | 70 | 140 | 290 | 400 | 600 | 800 | 1500 | —- |
| 0.4-0.6 |
—
|
40 | 40 | 50 | 70 | 100 | 140 | 290 | 400 | 600 | 800 | 2000 | 4000 |
| 0.3-0.4 |
0.5%
|
40 | 50 | 50 | 70 | 100 | 160 | 300 | 400 | 900 | 1000 | 3000 | 5000 |
| 0.2-0.3 |
2%
|
50 | 50 | 60 | 80 | 110 | 170 | 300 | 410 | 1000 | 1300 | 3000 | —- |
| 0.1-0.2 |
10%
|
60 | 60 | 70 | 100 | 150 | 200 | 370 | 530 | 1200 | 2000 | 4000 | —- |
| 0.0-0.1 |
51%
|
100 | 110 | 110 | 160 | 190 | 250 | 360 | 900 | —- | —- | —- | —- |
